Climate · 2024
Tideline
A public flood-warning service that shows how sure the forecast is, not only what it says.
- Client
- Port Ellery Council (sample client)
- Role
- Product designer and front-end lead
- Team
- The council’s resilience team, a hydrologist and two developers
- Duration
- 5 months
At a glance
- 3×more residents signed up for alerts
- −41%calls to the council during warnings
- 4 → 1websites merged into one service
Results are sample figures for this fictional project.
The problem
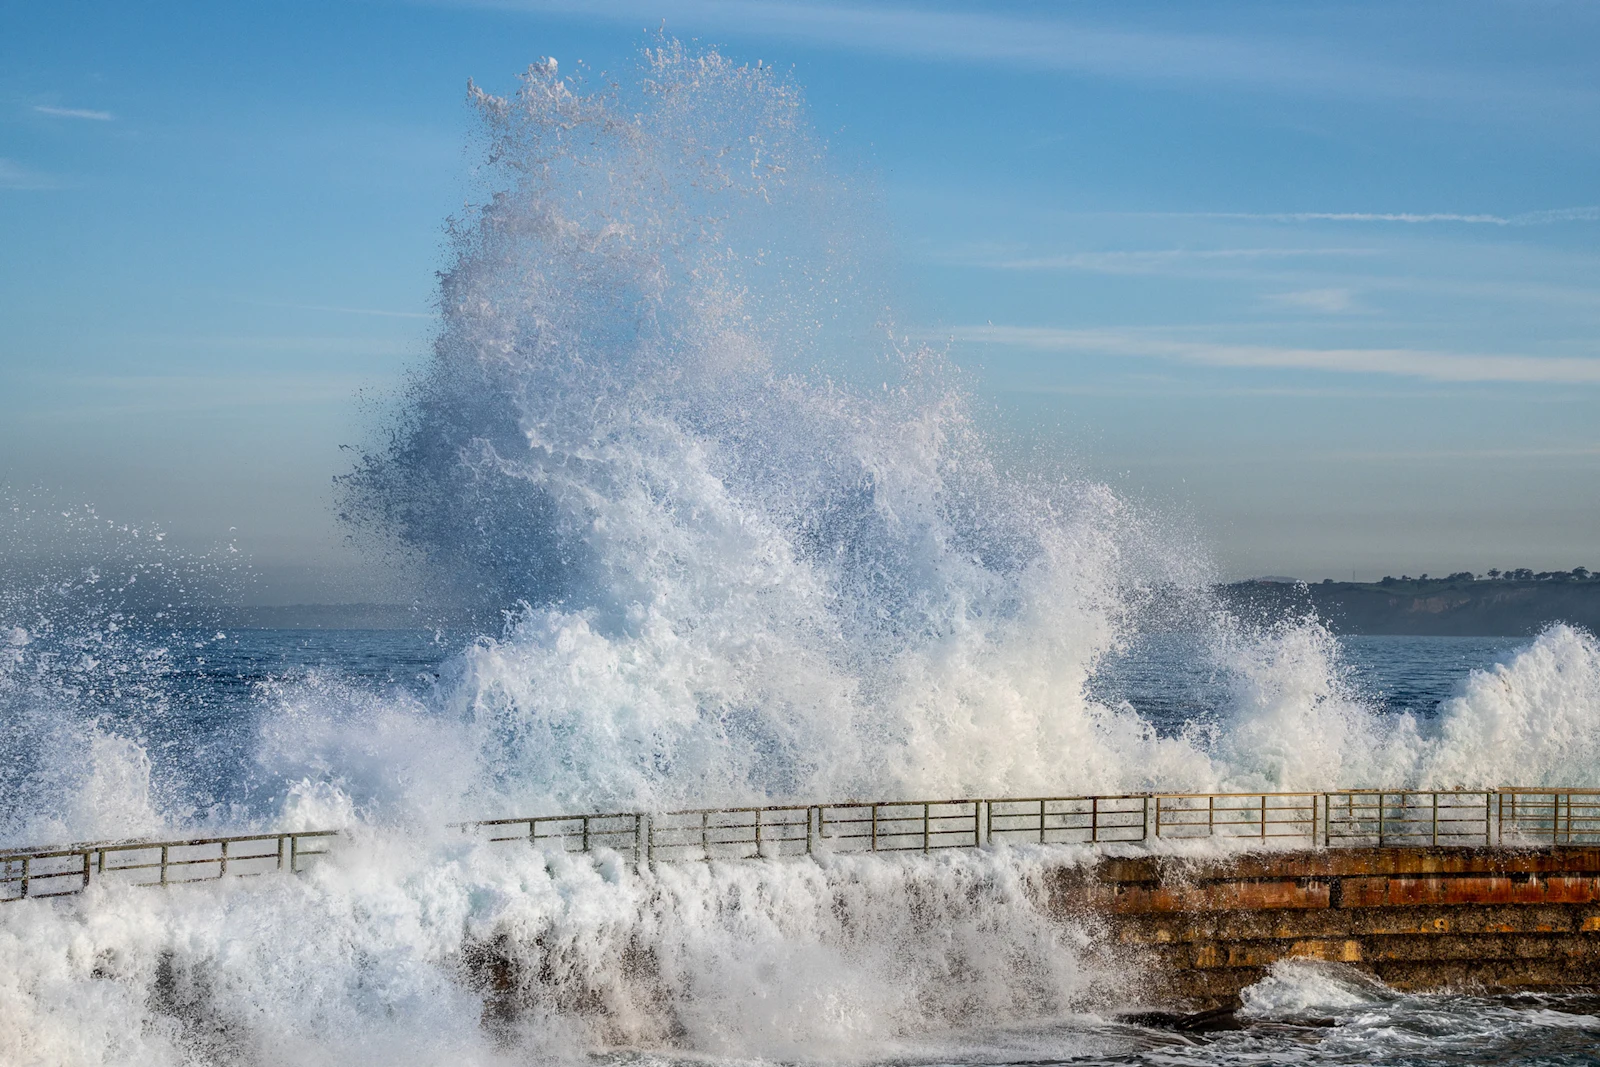
Port Ellery had four websites about flooding, each run by a different team. During a storm, residents saw a gauge reading of “4.62 m” and had no idea whether to move the car.
The council phone line took the questions the websites could not answer, at the exact moment staff were needed elsewhere.
What people actually asked
We read two winters of call logs. Almost nobody asked how high the water was. They asked what to do, when, and whether their street was affected.
Interviews with residents of the harbour streets added a second finding: people trusted forecasts more when they were told how uncertain they were.
Action first, then the numbers
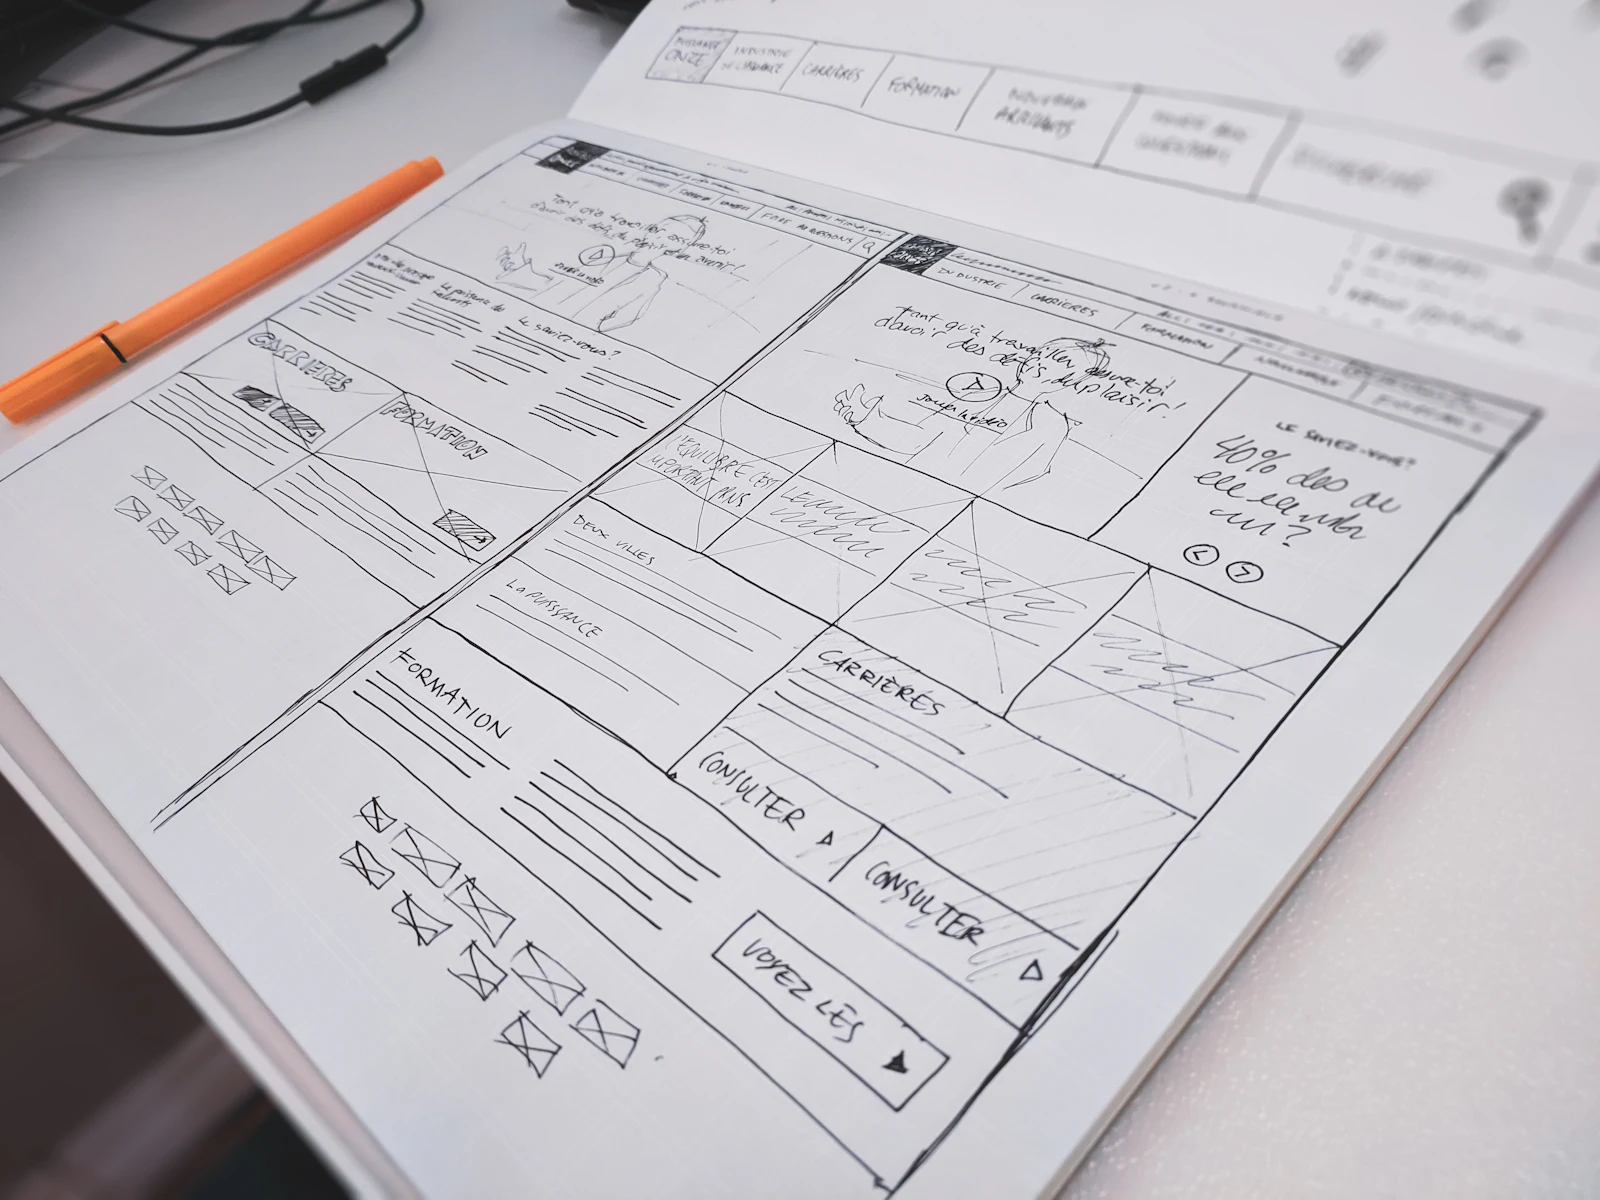
Every warning leads with a single action word: Watch, Prepare, Act or Leave. The tide forecast is drawn as a range with a likely band, never as a falsely exact line.
Flood zones are hatched as well as coloured, so they read in greyscale, for colour-blind residents and on the library’s black-and-white printer.
- a range, not a false-precise number
- hatching still reads in greyscale
- the action word comes first
For the first time our residents were a step ahead of the water, not a step behind the phone queue.
Fast, plain and printable
The service is static HTML regenerated every five minutes, so it stays up when traffic spikes. Every map has a table alternative listing streets and their risk, which also became the most-used view on phones.
What changed
Alert sign-ups tripled in the first winter and calls to the council during warnings fell by forty-one per cent. Three old sites were switched off.
What I’d do differently
I underestimated paper. The printed summary pinned up in the harbour café was read by more people in the first storm than the website was. Next time I would design the poster first.
Sample case study: the client, team, figures and quote are fictional.